Runs Panel – Inspecting Scenario History
The Runs panel is the audit trail for everything that executed as a complete scenario, whether started manually or by the Orchestrator. Runs launched from a selected branch of the action tree are not recorded — only full-scenario executions appear.
The panel was called Recent Runs in 0.14.2; the sidebar button is now Runs. The log viewer was rebuilt in 0.23 with column filtering and external-log support.
Why it matters
- Verify that overnight jobs finished.
- Pinpoint the exact action, log line and screen where a failure happened.
- Keep evidence of what the robot did, for audits and for handovers.
Opening the panel
Click the clock icon in the sidebar. The list of past runs appears on one side and the detail of the selected run on the other; with nothing selected the detail pane reads No selected run data. Reload Runs refreshes the list — use it when another Editor instance is executing scenarios.
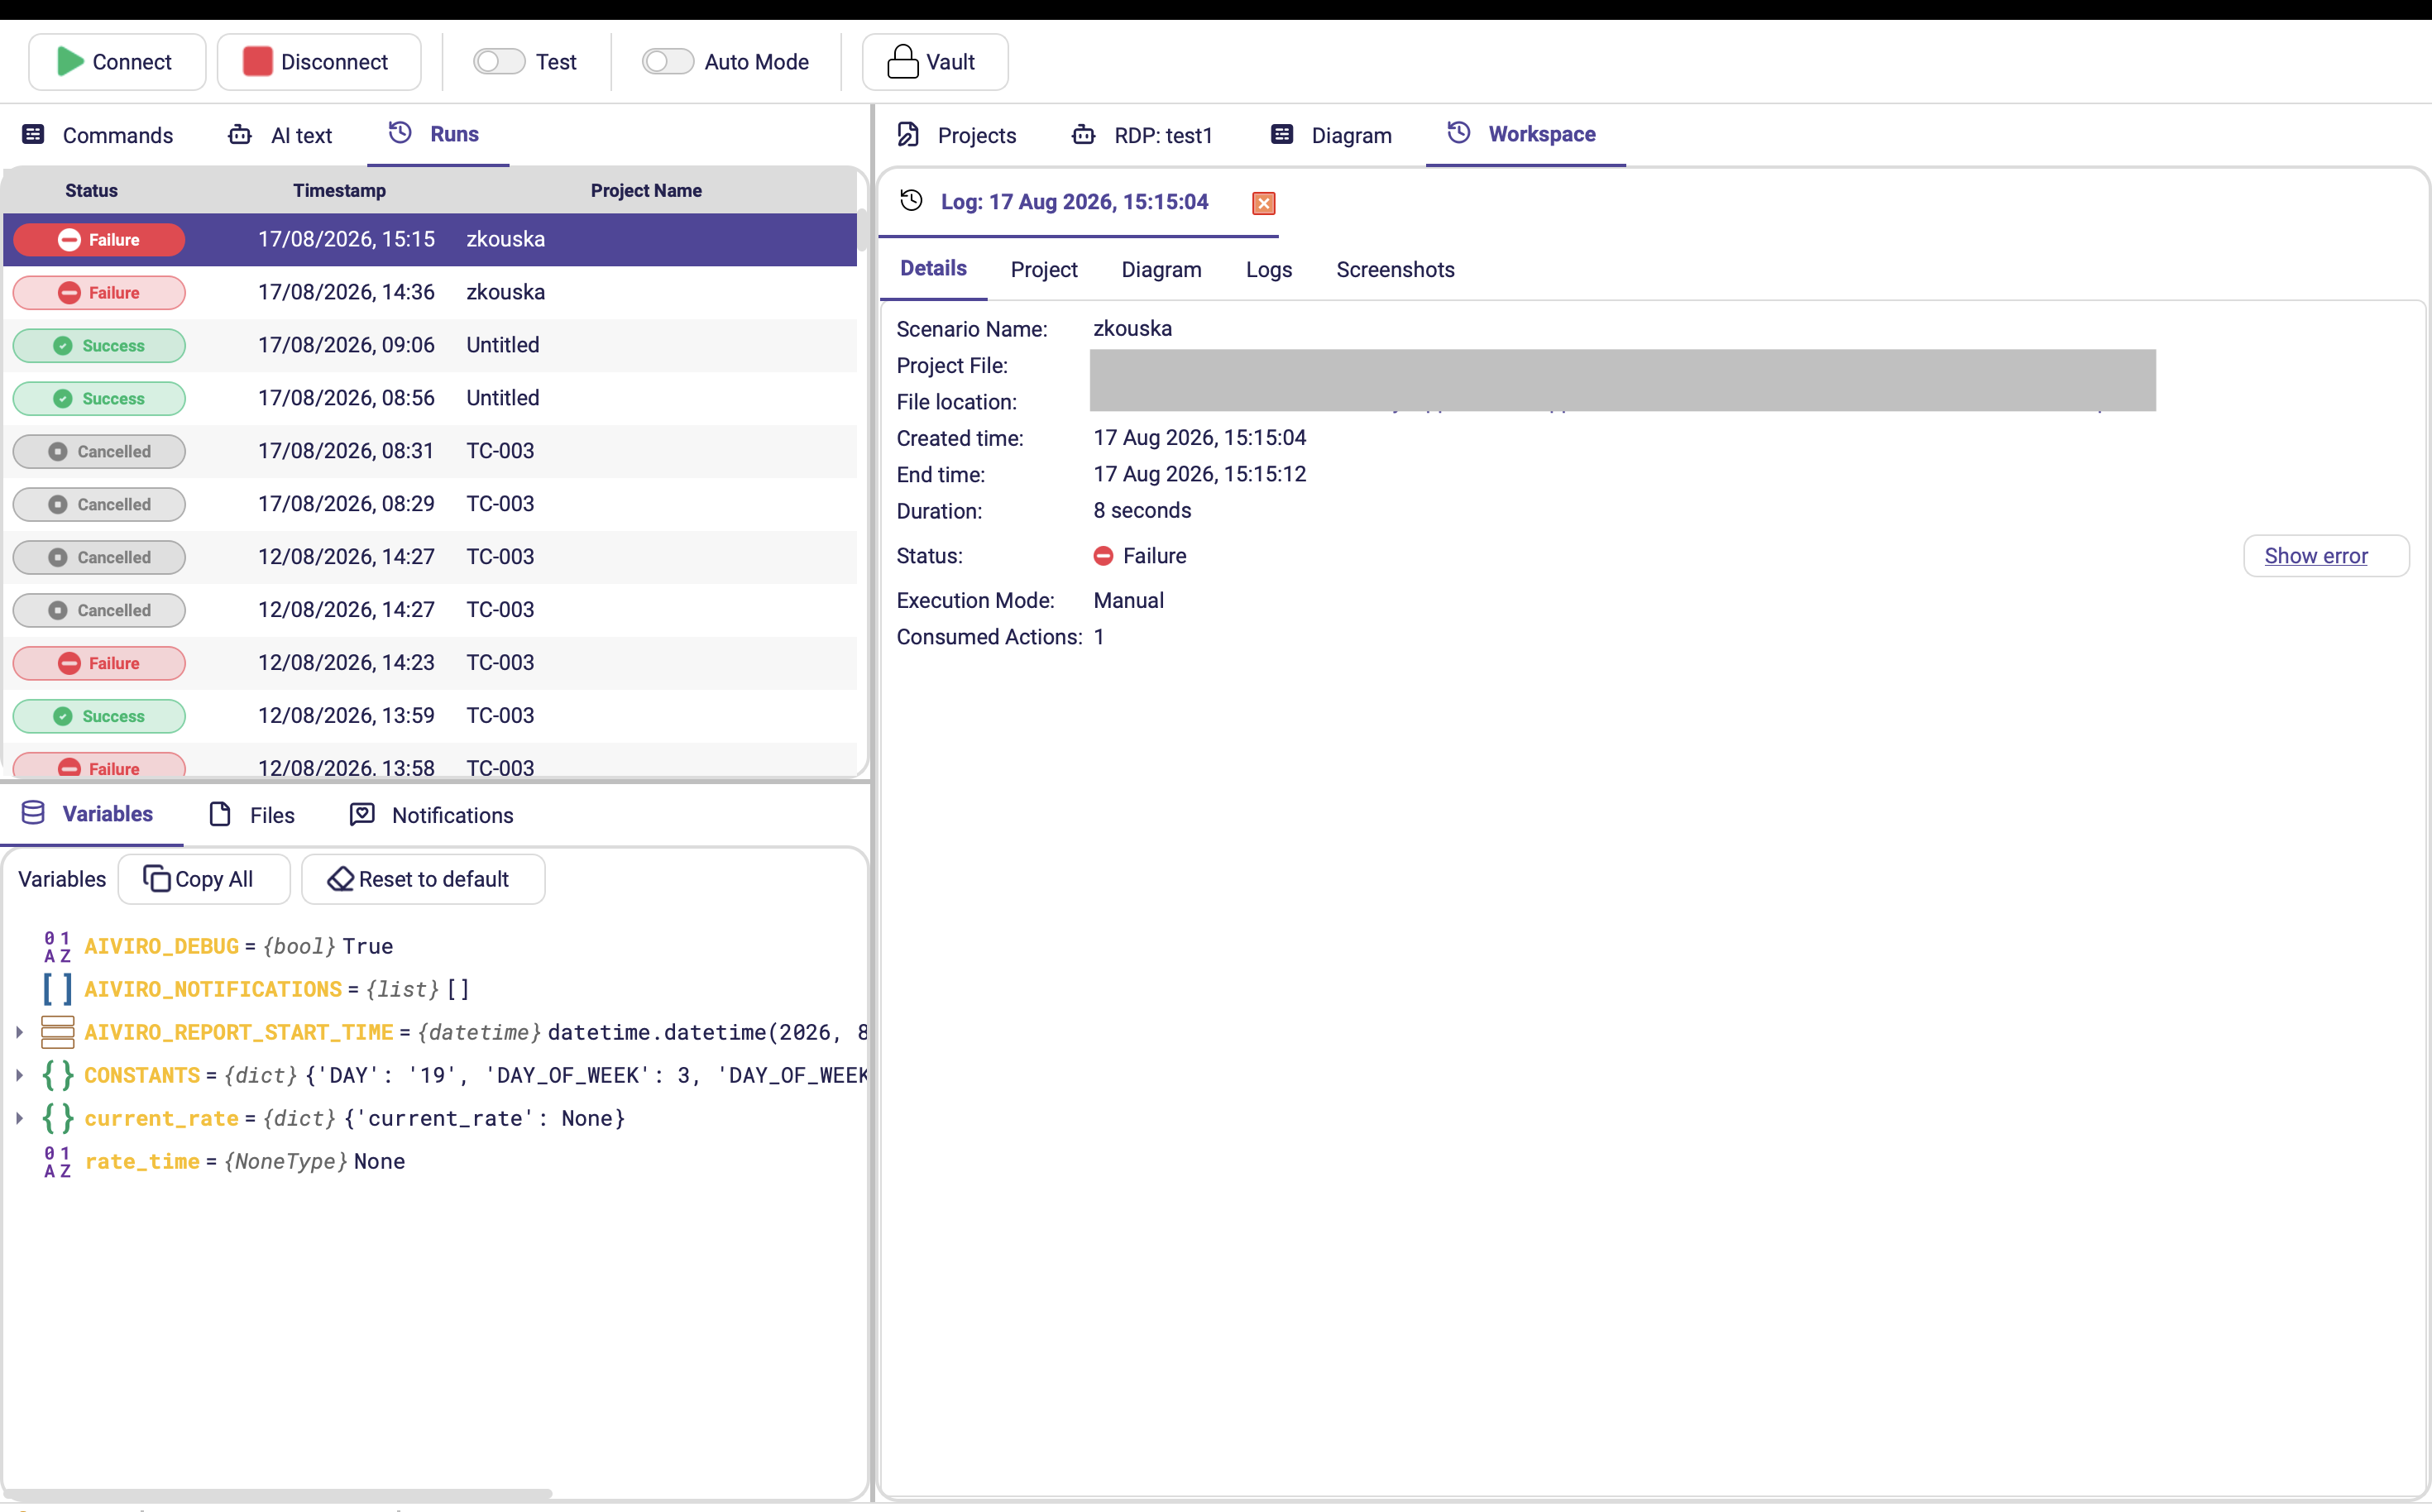
Run statuses
| Status | Meaning |
|---|---|
| Success | Finished without errors. |
| Success - retried after exception | Finished, but at least one action failed and was retried. Worth investigating — the scenario is fragile even though the run is green. |
| Failure | An action ended with an error and the scenario stopped. |
| Cancelled | Stopped deliberately with Stop. |
| Cancelled - Force quit | Aborted with Force Stop. |
| Corrupted | The run log could not be read completely. |
Each run also records its Execution Mode — Manual or Scheduled — which tells you whether a person or the Orchestrator started it.
Tabs
| Tab | What you see | Typical use |
|---|---|---|
| Details | Scenario Name, Project File, File location, Created time, End time, Duration, Status and Execution Mode. | Quick health check and runtime statistics. |
| Project | Read-only tree of all actions exactly as in the scenario, each marked with the state it ended in. | Locate the precise step that failed. |
| Logs | Chronological log with Time, Level and Message columns. | Read warnings, errors and values printed during the run. |
| Screenshots | Gallery of the screen captured through the run. | See what the robot actually saw at any point. |
Combine all three to understand why a step failed: find the failing action in Project, read its message in Logs, then look at the Screenshots taken around it.
Action states in the Project tab
| State | Meaning |
|---|---|
| Success | The action completed. |
| Error | The action failed and stopped the scenario. |
| Error - skipped | The action failed but had Required success off, so the run continued. |
| Skipped | The action did not run — Run Action was Disabled, or its environment or failure condition did not apply. |
| Stopped | Execution was interrupted at this action. |
| Not executed | The run never reached this action. |
| Running | Currently executing. |
| Unknown | The log was written by a newer Editor version than the one reading it. |
Error - skipped deserves attention. The run is green overall, but something did fail — scanning for it regularly catches scenarios that have been quietly half-working for weeks.
Variable snapshots
Whenever a step changes any variable, the Logs tab records a highlighted Variables snapshot row. This is the fastest way to answer "what did the scenario actually have in that variable when it broke?"
| Action | Effect |
|---|---|
| Double-click the row, or right-click → Show variables | Inspect every variable's name, type and value at that exact moment. |
| Right-click → Load into variables | Puts that snapshot back into the Variables panel, so you can reproduce and continue from the state where things went wrong. |
Secret values from the Vault are never stored in snapshots.
Use the Log action (Tools) to write your own messages into the same log — handy for marking the phases of a long scenario.
/img/editor/recent-runs/variables-snapshot.pngCapture: the Logs tab with a highlighted Variables snapshot row and the snapshot inspector open next to it. Not the Screenshots tab: the supplied shot showed the run detail on Screenshots, so neither the snapshot row nor the inspector was visible. Open Logs and double-click a Variables snapshot row before capturing. Switch to sample data first: the same shot also exposed a recipient e-mail address, a customer portal URL and a shared-drive path in the Variables panel and the status bar. Why it is new: snapshots did not exist before 0.24.0.
Filtering and external logs
| Feature | How |
|---|---|
| Filter a column | Right-click a filterable column header. An active filter is marked with a dot on the header. |
| Status column | The runs list shows a coloured Status badge, so a failed run is visible at a glance. |
| Log levels | Entries are classified DEBUG, INFO, WARNING, ERROR. Set Settings → Edit Configuration → Aiviro → Logging Level to DEBUG before reproducing a problem. |
| Open an external log | File → Open external log → .zip log (editor) or log directory (core). This is how you inspect a run from a colleague's machine or a production VM. |
Sending a run to support
Right-click any run — in this panel or in the runs list:
| Command | Effect |
|---|---|
| Show in Folder | Opens the file manager with that run's log file already selected. |
| Copy path | Copies the path, ready to paste into a chat or ticket. |
In a run's Details tab, File location is itself a clickable link that does the same.
This replaces digging through a folder of anonymous .zip files. When support asks for "the
log from that run", right-click → Show in Folder and attach what it highlights.
When an action fails
A failed action raises an Action Failed dialog written in plain language, with Retry and Copy Error Log buttons instead of a raw stack trace. Copy Error Log is what to paste into a support ticket.
File → Open external log → .zip log (editor) points at the packaged log for a run. Attach that archive to a support ticket — it carries the log, the action results and the screenshots together.
Investigating a failure
- Select the failed run at the top of the list.
- In Project, expand the tree until you find the first action marked Error — that is where the trouble started, not necessarily where the run stopped.
- Switch to Logs and read the message at the matching timestamp.
- Open Screenshots and look at the same point. Most failures are one of: the screen was not ready yet (add a Wait For), the element was there but described too loosely (tighten the search object), or an unexpected dialog appeared.
- Fix the scenario, re-run, and confirm the entry turns green.
Related
- Messages added with Add Message appear in the Notifications panel and in the e-mail report — see Notification actions.
- Files the robot produced are reachable from the Files panel.